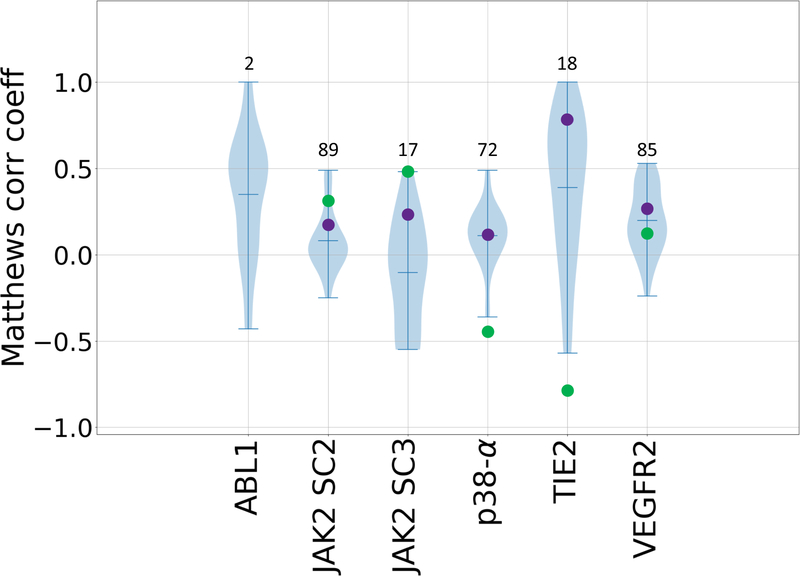
Figure 5.
Violin plots of Matthews correlation coefficients between predicted classifications and experimental Kd classifications of active and inactive compounds for all six kinase datasets: ABL1, JAK2 SC2, JAK2 SC3, p38-a, TIE2, and VEGFR2. Mean, minimum, and maximum Matthews correlation coefficients for each target are shown by whiskers. Null models based on clogP and molecular weight are shown in green and purple respectively. Null models were not calculated for the ABL1 target, since this subchallenge only contains two ligands. The number of ligands for each subchallenge is given above each column.

