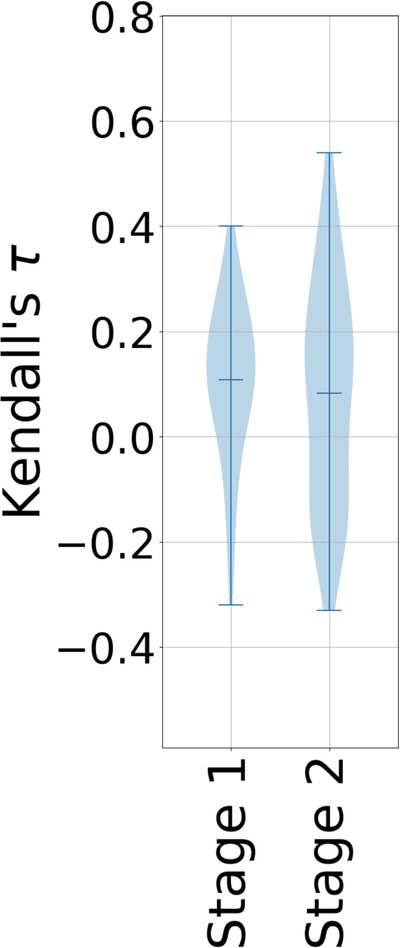
Figure 6.

Violin plots of Kendall’s τ ranking correlation coefficients between predicted rankings and experimental IC50 rankings for the CatS dataset in Stages 1 and 2, using only the 18 ligands for which crystallographic poses had been provided in Stage 2 (CatS 1 to CatS 24, excluding CatS 7, 9, 11, 14, and 21). Mean, minimum, and maximum Kendall’s τs for each CatS stage are shown by whiskers.
