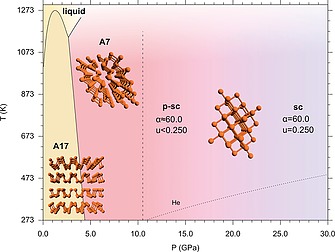
Figure 5.

In the 10.0–30.0 GPa pressure range the phase diagram of elemental Phosphorus shows the regions of pressure and temperature in which A17 and A7 phases are stable.42, 43, 44 In contrast to the reported data, where the phase transition from A7 to sc is at 10.5 GPa (marked by the dashed line), our data show that at room temperature the sc phase is not present up to 27.6 GPa and that between the A7 and the sc structures an intermediate pseudo simple‐cubic (p‐sc) structure exists (see text). The melting line of He is also displayed (dotted line).44 In the figure the models of the structure are also displayed in the corresponding phases. Reproduced from ref.45.
