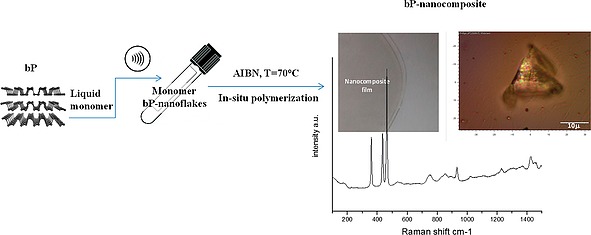
Figure 9.

Schematic representation of bP nanocomposites preparation by sonication‐assisted bP‐LPE in the monomer (NVP) followed by in situ polymerization; picture of film, optical microscopy of a portion of film showing a bP‐nanoflakes aggregate and Raman spectrum of composite showing the diagnostic signals of bP (the Ag 1, B2g, Ag 2 modes) together with bands associated to the polymer matrix (see ref.84). Reprinted with permission and adapted from Figure 2f and Figure 3e of ref.84 Copyright 2018 American Chemical Society.
