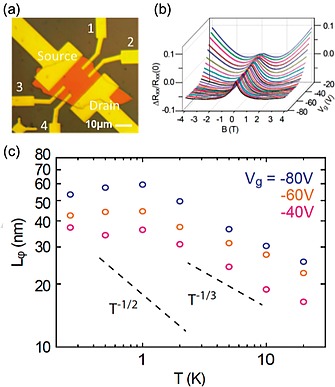
Figure 12.

(a) Optical reflection microscopy image of a bP FET. The longitudinal resistance R xx is measured with voltage probes 1 and 2. (b) Weak localization measurements. A weak localization peak is observed in this plot of the normalized longitudinal resistance [R xx(B) – R xx(0)]/R xx(0) vs. magnetic field B and gate voltage V g at T = 0.26 K. (c) The inelastic scattering length L φ vs. temperature T at various gate voltages V g. The T –1/2 temperature dependence associated with electron‐electron scattering in the 2D diffusive limit is shown for comparison, as well as a T –1/3 power law. Adapted from ref.133 Copyright (2016) The Authors.
