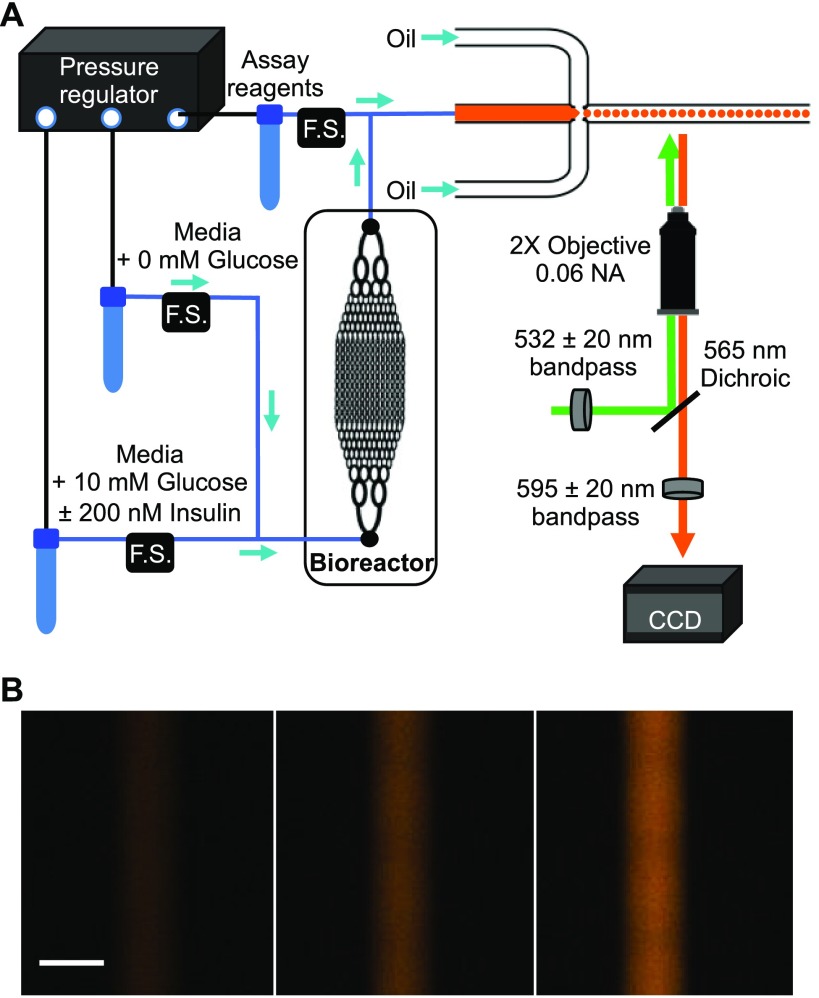
Figure 1.
Setup for automated perfusion of HepG2 with online glucose monitoring. (A) A pressure-driven flow system was used to deliver media containing different concentrations of glucose and insulin to the input of the bioreactor. Flow sensors (F.S.) were used to maintain accurate flow rates of the reagents. The output of the bioreactor mixed with enzymatic glucose assay reagents for 54 s before entering a flow-focusing device that generated droplets. (B) A zoomed-in region is shown from three fluorescence images of the channel containing the droplets during a 42 ms exposure. From left to right, the final glucose concentration was 2.4, 7.2, and 12 mM. The scale bar is 390 μm.

