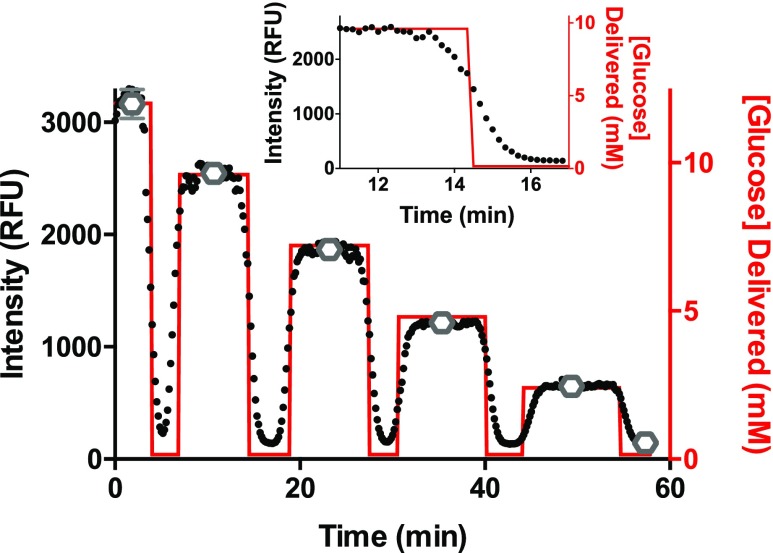
Figure 2.
Online glucose assay calibration. The calibration of resorufin fluorescence to glucose concentrations from 0–12 mM is shown. The black data points are the background-subtracted resorufin intensity values taken every 5 s from 18 droplets and correspond to the left y-axis. The red line represents the known glucose concentration that was delivered to the perfusion system. The average resorufin intensity at each glucose plateau is shown by the open gray circles with ±1 SD shown by the error bars. The inset is a zoomed-in portion of the shaded region highlighting the response time from one calibration solution.

