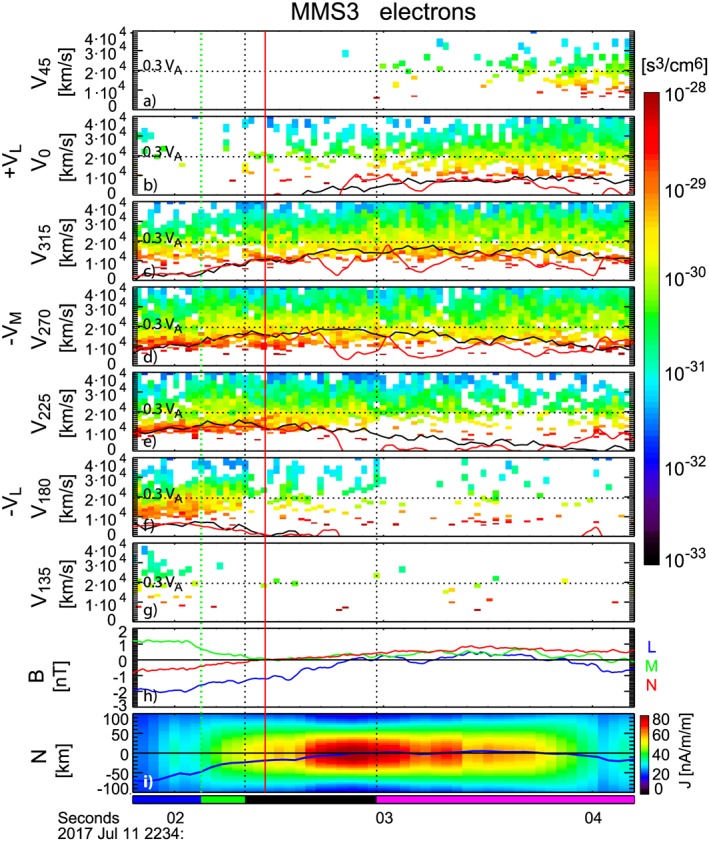
Figure 2.

Magnetospheric Multiscale 3 (MMS3) electron velocity spectra near the X‐line crossing and the location of the spacecraft relative to the current sheet. Velocity spectra cuts in directions within the L‐M plane along the (a) V 45, (b) V 0, or +V L, (c) V 315, (d) V 270, or −V M, (e) V 225, (f) V 180, or –V L, and (g) V 135 directions shown in Figure 3a and explained in the text. (h) L (blue), M (green), and N (red) components of the magnetic field. (i) N coordinate of MMS3 within the model current sheet. In (a)–(g) the bulk velocity and the E × B drift components along the direction of the cuts are shown as black and red curves, and the horizontal dotted line indicates the velocity level of 0.3 V A = 19,500 km/s. The vertical red line indicates the crossing of the X‐line in the L direction by MMS 3 at 22:34:02.4 UT. The vertical dotted lines show the demarcation of the four regions with different characteristics of the velocity distribution function marked with bars at the bottom, representing the region outside the thin current sheet (blue), the tailward outflow jet region (green), the inner Electron Diffusion Region (black), and the earthward outflow jet region (magenta).
