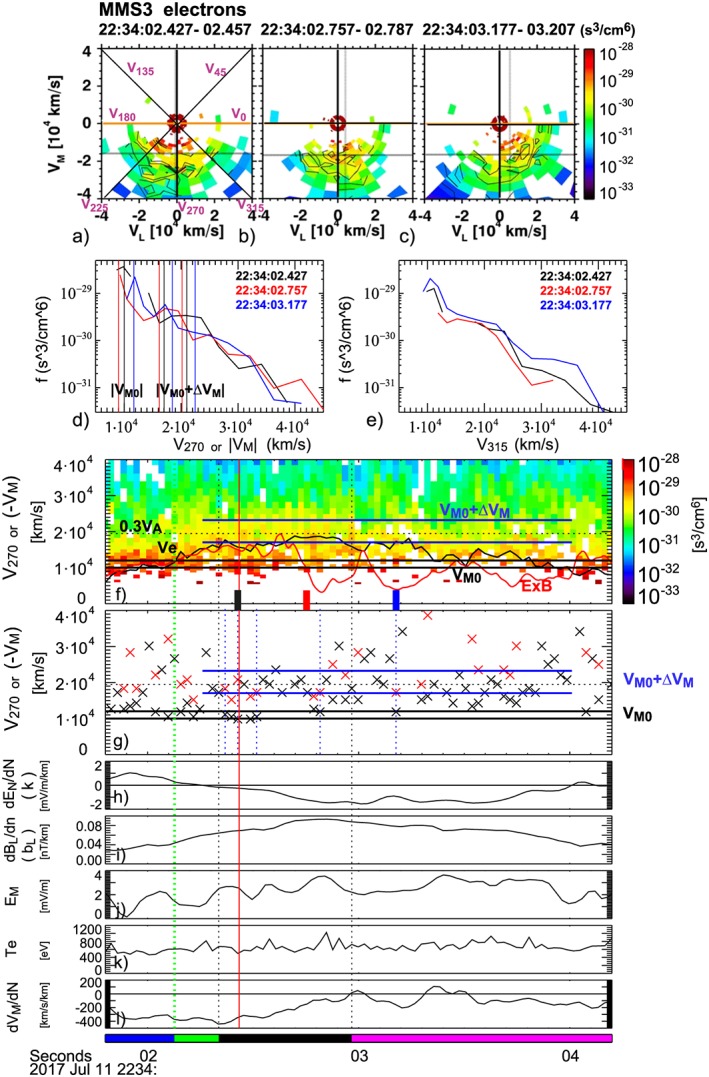
Figure 3.

Magnetospheric Multiscale 3 (MMS3) electron velocity distribution function and gradient parameters. Two‐dimensional cuts in the velocity distribution function in the L‐M plane for (a) 22:34:02.427–22:34:02.457 UT (showing V α directions for the velocity distribution cuts displayed in Figure 2), (b) 22:34:02.757–22:34:02.787 UT, (c) 22:34:03.177–22:34:03.207 UT, and 1‐D cut along (d) the V 270 (i.e., −V M) direction and (e) the V 315 direction for the distribution functions shown in (a)–(c). (f) Velocity spectra cuts along the V 270 or −V M direction, (g) velocity of the first (black cross) and second (red cross) peak in the spectra cuts along the V 270 direction, (h) dE N/dN, (i) dB L/dN, (j) E M, and (k) electron temperature from MMS 3, and (l) dV M/dN. The gradient parameters in (h), (i), and (l), are obtained from the linear gradient method (Chanteur, 1998). The vertical lines in (d) and horizontal lines in (f) and (g) indicated as V M0 are used to estimate the predicted ranges of the second peak in the distribution function, V M0 + ∆V M, shown as vertical (d) and horizontal (f, g) lines using model from Bessho et al. (2014) for meandering electrons accelerated by the reconnection electric field. The thin blue dotted lines in (g) indicate those times when both first and second peaks in the distribution function are identified in the data as predicted by the model (see more detailed explanation in the text). The electron bulk velocity (black) and the E × B drift (red) are also shown in (f). The other vertical lines in (f)–(l) and the bottom bars are the same as in Figure 2.
