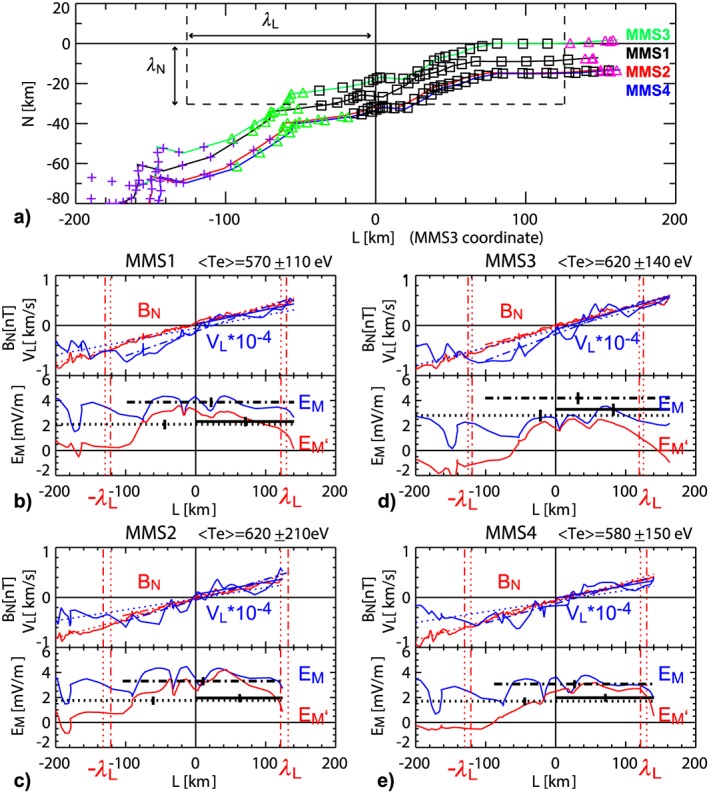
Figure 4.

Orbit of the four spacecraft relative to X‐line and changes in reconnection parameter along L. (a) Location of the four spacecraft between 22:34:01.7 and 22:34:03.1 UT relative to the X‐line observed by Magnetospheric Multiscale 3 (MMS3). The colored symbols show the four different velocity distribution function patterns (purple: outside separatrix, green: tailward outflow jet region, black: inner EDR, magenta: earthward outflow jet region). The color of the curves represents the different spacecraft (black: MMS1, red: MMS2, green: MMS3, blue: MMS4). (b) B N,(red) and V eL, (blue; upper panel) and E M,(blue) and E M’ (red; lower panel) along L measured relative to the X‐line for MMS1. Linear fits to the curves are shown for B N and V eL (upper panel) to obtain the gradients, ∂V L/∂L and ∂B N/∂l for estimating λL and E M,NG, respectively. The linear fit and corresponding parameter estimations are performed for the interval 22:34:01.7–22:34:03.1 UT (dotted lines), for data |N| < 50 km (dash‐dotted lines) and for L > 0 km (solid lines). Average temperature and its standard deviation for the interval 22:34:01.7–22:34:03.1 UT are given above the panels. The errors of the E N,NG estimation calculated using this temperature fluctuations and the standard error of regression slope are given as vertical ticks on the horizontal bars in the lower panels. (c)–(e) are same as (b) but for MMS2, MMS3, and MMS4, respectively.
