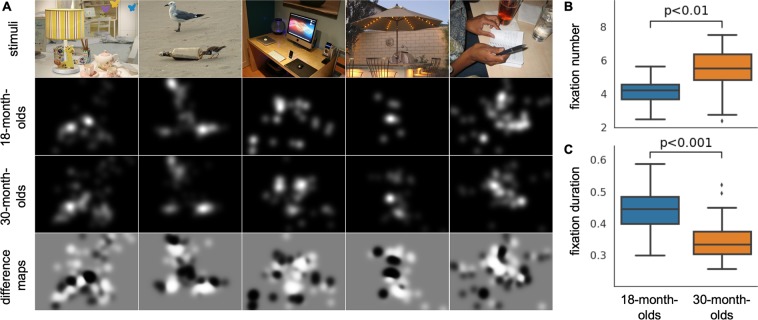
Figure 1.
Basic eye movement metrics. (A) Examples of the visual stimuli, fixation maps of each age group, and difference maps. In the difference maps, bright regions attract more fixations from the 30-month-olds, while dark regions attract more fixations from the 18-month-olds. (B,C) Significant differences between age groups were observed. (B) 30-month-olds had more fixations than 18-month-olds. (C) 30-month-olds had shorter average fixation durations than 18-month-olds.

