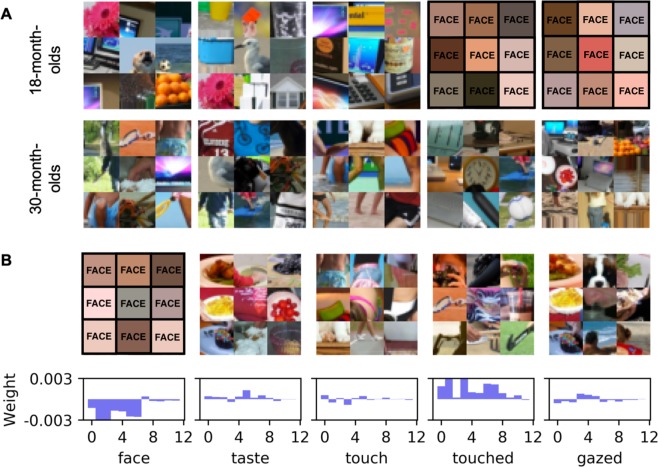
Figure 4.
Visualization of DL features. (A) Visualization of the DL feature channels sorted into columns corresponding to classification weights. The lowest weights (row 1) correspond to 18-month-olds and the highest weights (row 2) correspond to 30-month-olds. Image patches represent features that are most characteristic of looking patterns for each age group across all fixations. (B) Visualization and classification weights of the DL features corresponding to each feature from Fig. 2B. Features that most strongly correlate with the labeled semantic features are presented. Bars indicate the evolution of classification weights across fixations. Higher classification weights suggest that 30-month-olds are more likely to fixate the feature than 18-month-olds. Note: for privacy reasons, faces are blocked in this Figure. Faces were intact in the original stimuli viewed by participants.

