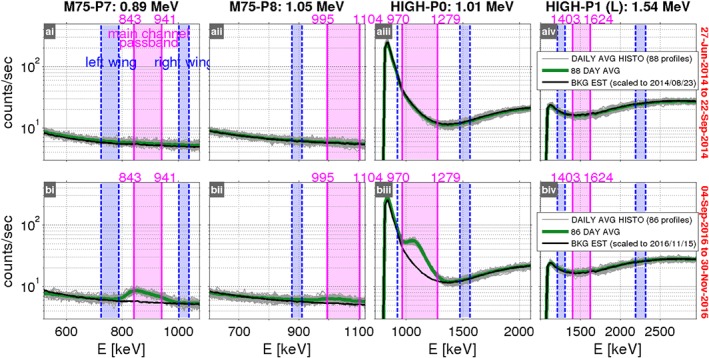
Figure 2.

Magnetic Electron Ion Spectrometer histogram data from the four pixels that span the energy range 0.89 to 1.54 MeV, illustrating the alternative background correction technique. In each panel, the gray traces are daily averaged histogram count rates plotted versus energy in the inner zone (L = [1.5, 1.6]), near the magnetic equator (B/B eq ≤ 1.1), and centered on 90° local pitch angle (α = [80, 100]°). Each green trace is the average of the ∼90 gray traces. The assumed background due to inner belt proton contamination in each pixel is shown as the black trace, which is the green trace from row a, scaled to match a particular gray trace at the right wing. The histogram data are compared for two ∼90‐day time intervals: when there are no foreground electrons detectable above background (row a) and when there are foreground electrons detectable above background (row b). In the latter case, a peak appears within the main channel passband (highlighted in magenta), as in panels bi–biii. Valid foreground electrons can only appear in the magenta passband. Note that in a given pixel in row a, the gray traces do not vary significantly around the black trace, indicating that the assumed backgrounds are stable over these timescales.
