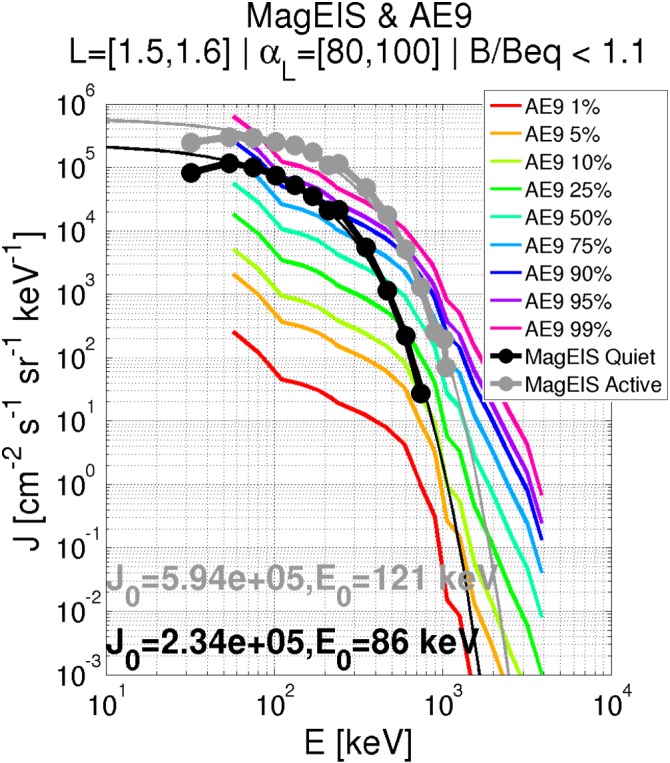
Figure 7.

A comparison of MagEIS spectra with those obtained from V1.0 of the AE9 empirical model (Ginet et al., 2013). Two MagEIS spectra are shown, both computed with the alternative background correction algorithm: one averaged over a 7‐day “quiet” interval, when no MeV electrons are observed in the inner zone (black; 21 July 2014 to 28 July 2014) and another averaged over an “active” 7‐day interval when MeV electrons are observed in the inner zone (gray; 1 January 2016 to 8 January 2016). The MagEIS quiet spectrum is nearly identical to that presented in Fennell et al. (2015), and the same AE9 model data are shown for comparison, where the 50th percentile corresponds to the median. Exponential fits are made to the MagEIS spectra (thin black and gray traces), with the fitting parameters indicated in the figure. MagEIS = Magnetic Electron Ion Spectrometer.
