
Figure 3.
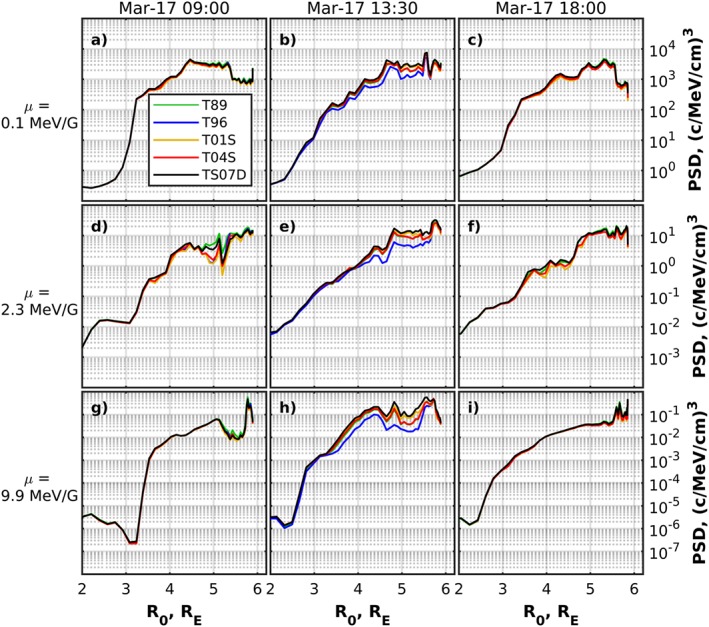
Profiles of electron PSD for K = 0.3 G1/2 R E and μ = 0.1 MeV/G (a–c), 2.3 MeV/G (d–f), and 9.9 MeV/G (g–i) calculated using different magnetic field models for three subsequent Van Allen Probe B passes. Columns correspond to the passes beginning at 9:00, 13:30, and 18:00 on 17 March (from left to right). PSD = phase space density.