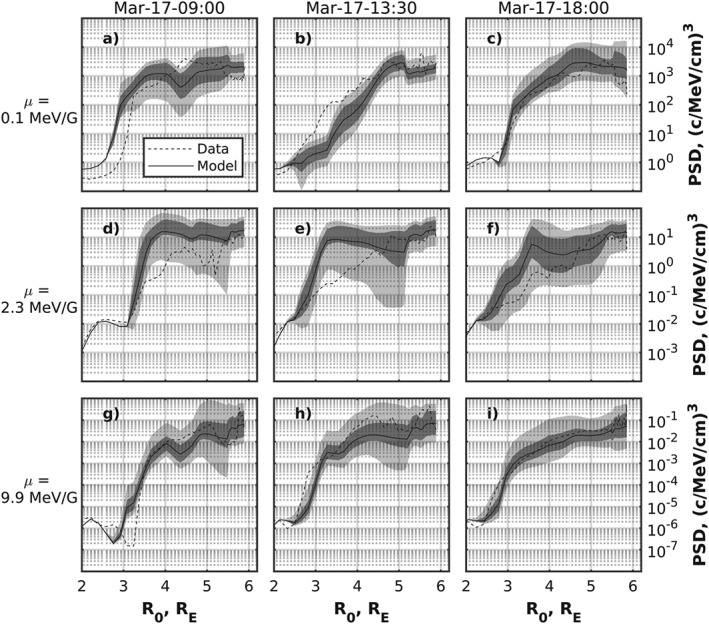
Figure 5.

Comparison between Van Allen Probe B data (dashed lines) with the VERB‐4D code results (solid lines) for K = 0.3 G1/2 R E and μ = 0.1 MeV/G (a–c), 2.3 MeV/G (d–f), and 9.9 MeV/G (g–i). Columns correspond to satellite passes beginning at 9:00, 13:30, and 18:00 on 17 March (from left to right). The dark gray regions are limited by the 25th and 75th percentiles of the outer radial boundary conditions. The light gray regions are limited by the 5th and 95th percentiles. PSD = phase space density.
