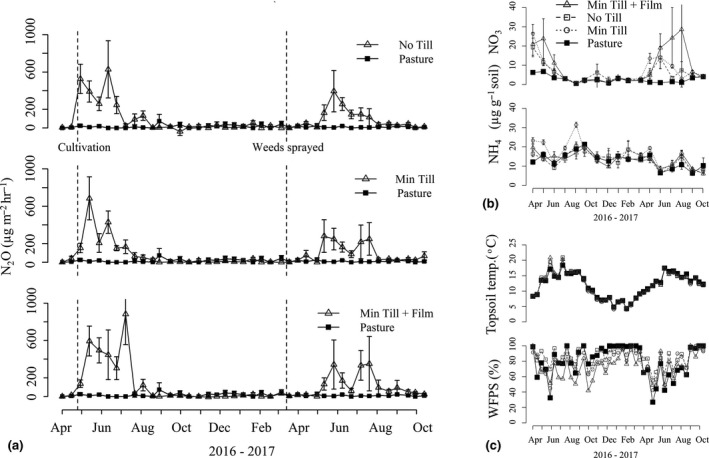
Figure 3.

(a) Mean N2O flux over the sampling period (12 April 2016 to 24 October 2017) for the no tillage (No Till), minimum tillage (Min Till) and minimum tillage with film (Min Till + Film) treatment in comparison with the established pasture control (Pasture). The dotted lines show the time of cultivation in 2016 and the herbicide sprayed in 2017. (b) Mean levels of NO3 ‐ and NH4 + in soil samples (0–15 cm depth) taken monthly from June 2016 to October 2017. (c) The mean soil temperature (0–10 cm depth) and water‐filled pore space (WFPS; 0–15 cm depth) across the treatments. The error bars in all the charts show the standard error of the mean
