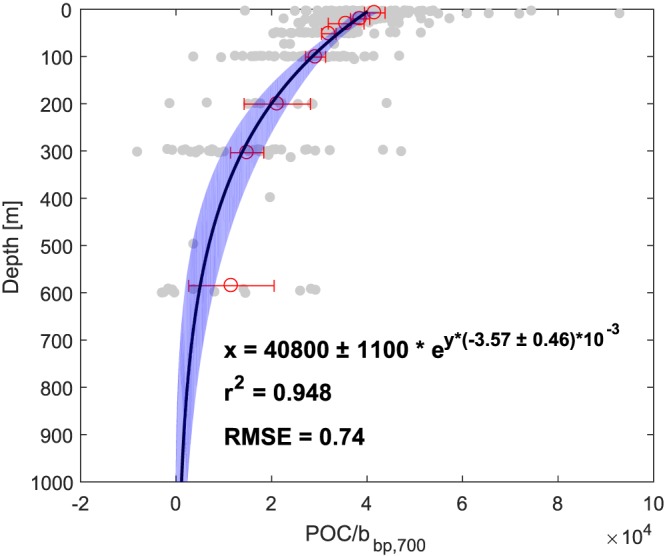
Figure 2.

Determination of POC/b bp slopes (λ = 700 nm) over depth from the NAB08 data set (data from Cetinić et al., 2012), with individual bottle data in gray, and slopes from a linear regression per depth bin in red (error bars represent the standard errors of the regressions). The black line is an exponential fit of the slopes per depth bin, weighted by the errors of the individual regressions (shaded blue area represents the confidence interval of the fit). POC = particulate organic carbon; RMSE = root‐mean‐square error.
