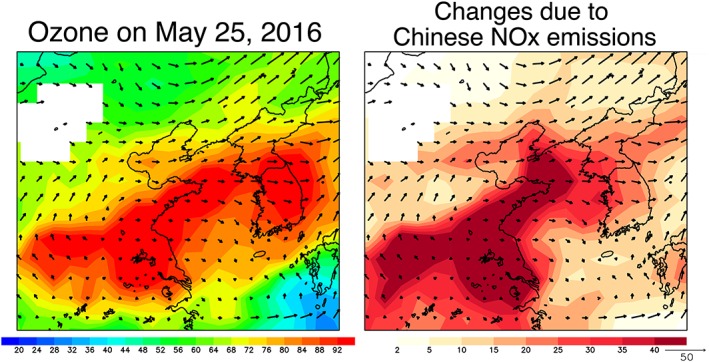
Figure 3.

Spatial distribution of ozone (in ppbv) at 850 hPa on 25 May 2016 from the reanalysis (left) and its changes due to Chinese NOx emissions (right). The impacts of Chinese NOx emissions were measured by comparing the results from a control model simulation (using the optimized emission from data assimilation) and sensitivity model simulations using modified NOx emissions where the emissions in China were set to zero. Vectors represent horizontal winds obtained from the general circulation model calculation nudged to ERA‐Interim.
