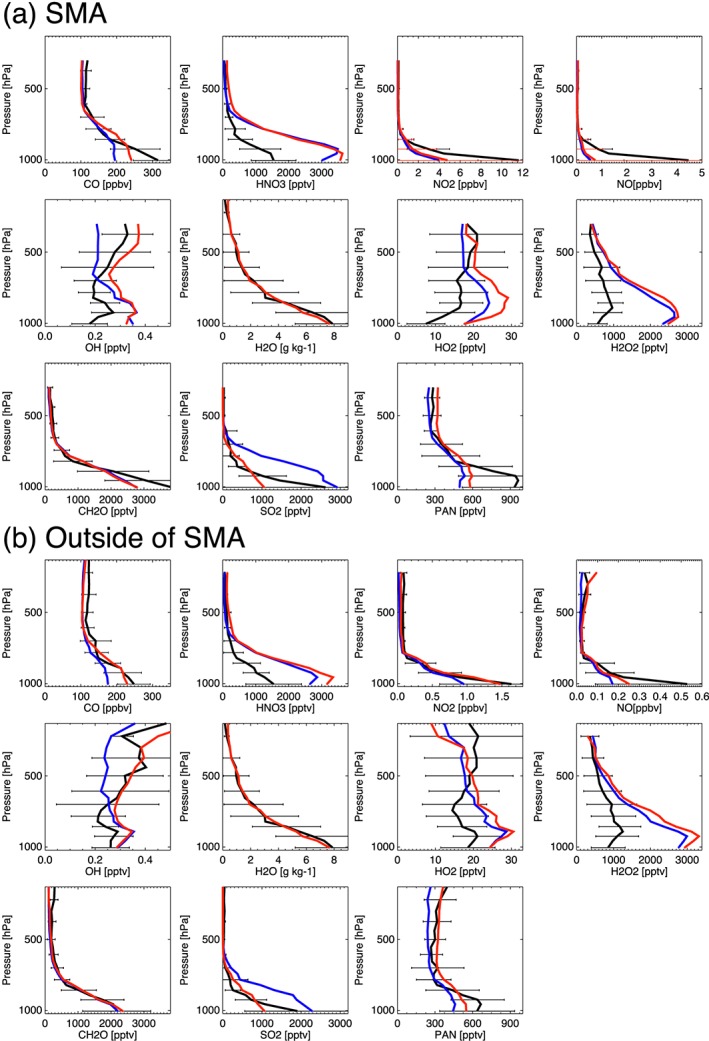
Figure 7.

Comparison of mean vertical profile between observations (black), model (blue), and reanalysis (red) for CO (ppbv), HNO3 (ppbv), SO2 (ppbv), NO2 (pptv), NO (pptv), OH (pptv), H2O (ppbv), HO2 (pptv), CH2O (pptv), and PAN (pptv) averaged over the Korea‐United States Air Quality campaign period. Results are shown for the profile (a) over and (b) outside of the Seoul metropolitan area (SMA).
