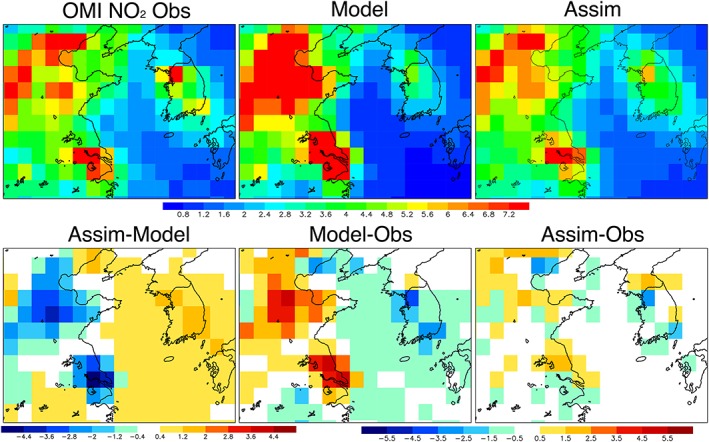
Figure 8.

Spatial distributions of tropospheric NO2 column (in 1015 molecules/cm2) from the QA4ECV OMI retrievals (upper left), model (upper center), and reanalysis (upper right). The lower panels show the difference between the assimilation and model simulation (left), between the model simulation and the satellite retrievals (center), and between the data assimilation and the satellite retrievals (right).
