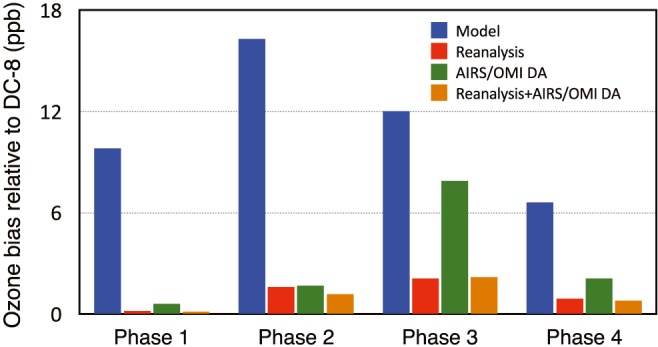
Figure 13.

Mean absolute values of ozone bias (in ppbv) relative to the DC‐8 aircraft measurements at 650 hPa for individual phases for the model calculation (blue), reanalysis (red), Atmospheric Infrared Sounder/Ozone Monitoring Instrument (AIRS/OMI) data assimilation (green), and reanalysis with assimilating AIRS/OMI data (orange).
