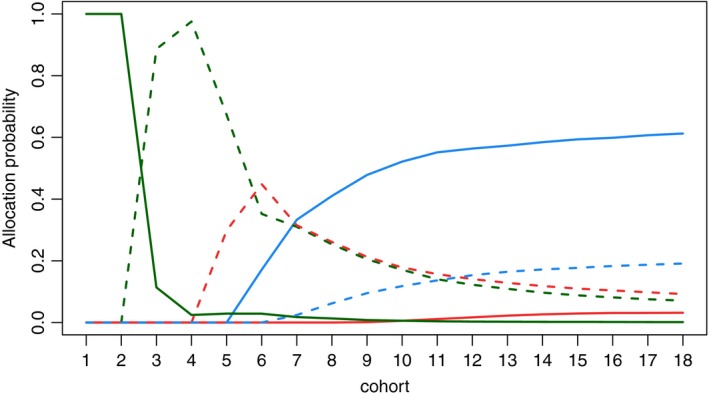
Figure 3.

Probabilities to allocate each of 18 cohorts to T
1 ( ), T
2 (
 ), T
3 (
 ), T
4 (
 ), T
5 (
 ) and T
6 (
 ) in the motivating trial setting: the optimal regimen is regimen T
4 and the correct regimens are regimens T
4 and T
5; results are based on 106 replications
