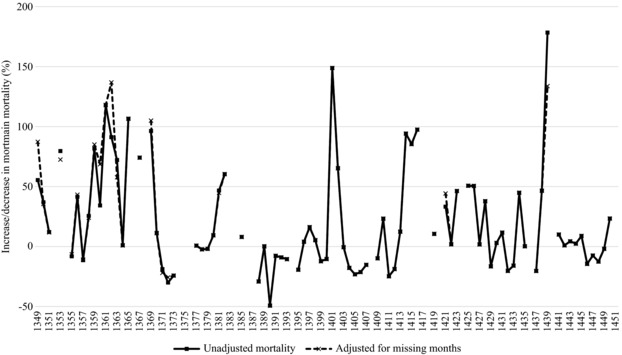
Figure 3.

Annual mortality based on increase or decrease (%) from the average number of mortmain per locality across the period 1349–1450, Hainaut
Sources: ADN, B 12122–12226; ARB, I, 004, 17867–73.

Annual mortality based on increase or decrease (%) from the average number of mortmain per locality across the period 1349–1450, Hainaut
Sources: ADN, B 12122–12226; ARB, I, 004, 17867–73.