
Figure 2.
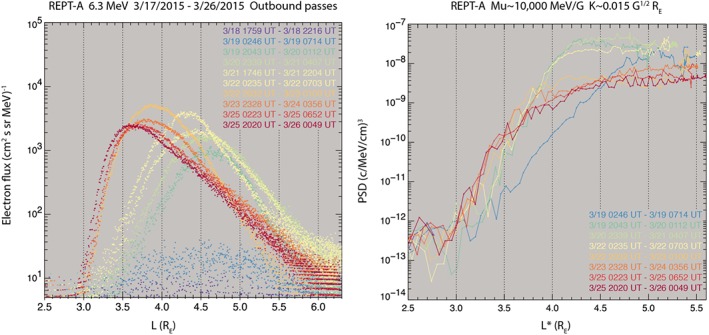
(left) Electron flux versus L‐shell for all outbound passes covering 18 March to 26 March for 6.3‐MeV electrons, color‐coded by date where cool colors are earlier times and warm colors are later times. (right) Phase space density versus L* (TS04D model) for the same time period (as data coverage allows) representing nearly equatorially mirroring electrons with μ = 10,000 MeV/G, with same color coding by time.