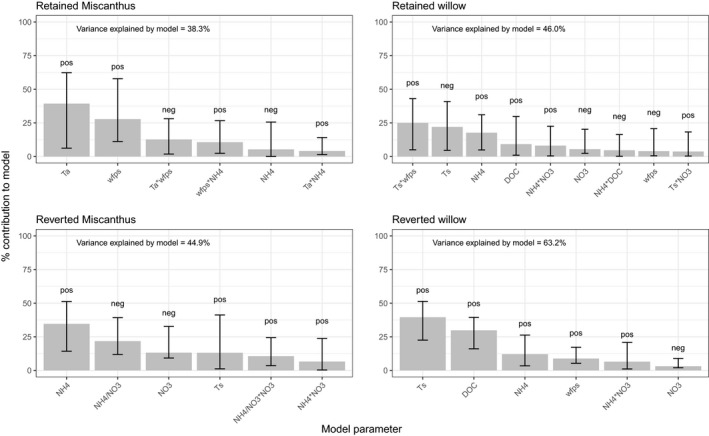
Figure 3.

Relative importance of significant parameters within each regression model for individual land‐use treatments. Text within each plot shows how much of the total variance in N2O flux was explained by the corresponding regression model, the fits of all models were significant at p < 0.001. Bar heights (Y axes) show the percentage contribution that each parameter made to the total variance explained by each model. Parameters were excluded from the model if their inclusion showed no improvement to the model's AIC score. Error bars show bootstrapped estimations (100 samples) of 95% confidence intervals around each mean percentage contribution. Pos/Neg above each bar indicates direction of the influence of the parameter on the N2O flux magnitude
