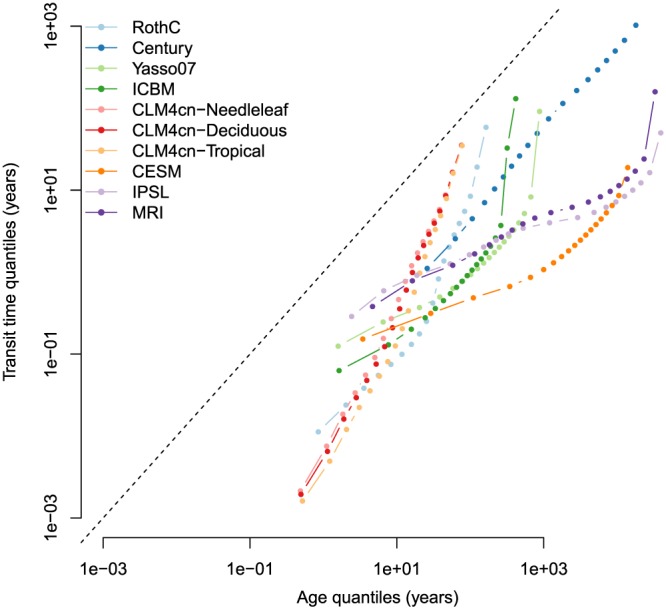
Figure 5.

Sequence of quantiles, from 5% to 95% by 5% increments, for the age and transit time distributions of soil organic carbon calculated for the models of Table (1). Dashed line represents the 1:1 line. Notice that axes are in logarithmic scale. ICBM = Introductory Carbon Balance Model; CLM4 = Community Land Model version 4; CESM = Community Earth System Model; IPSL = L'Institut Pierre‐Simon Laplace Coupled Model; MRI = Meteorological Research Institute Earth System Model.
