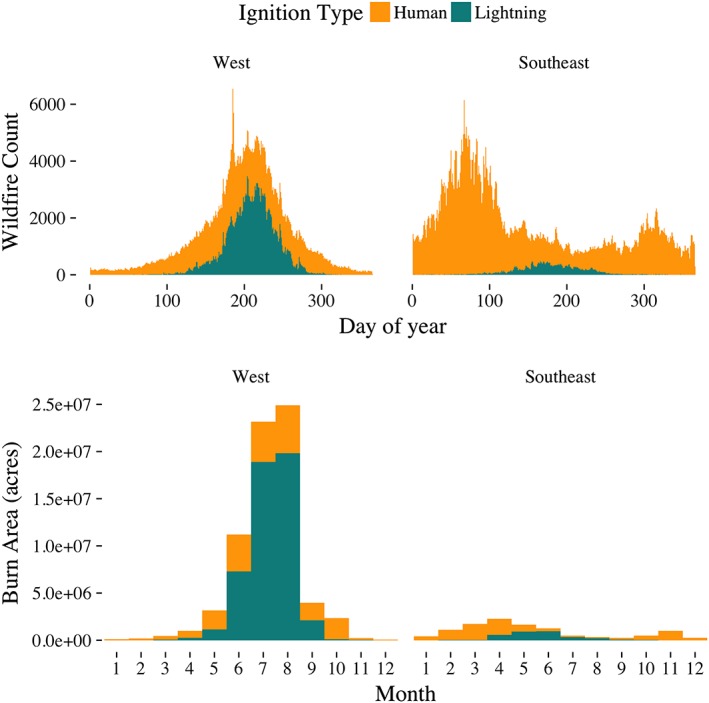
Figure 3.

The top row of this figure shows the number of wildfires discovered on a given day of the year in the west (left) and southeast (right) between 1992 and 2015. The bars are color coded by wildfire ignition type. The bottom row shows the monthly burn area that results from the wildfire ignitions shown in the top row. The burn area attributed to a given month is the sum of wildfire burn area for wildfires that started in that month. Wildfires with start causes listed as “Missing/Undefined” have been excluded from this figure. The most common day for ignitions is 4 July, an American holiday where the use of fireworks is a common form of celebration.
