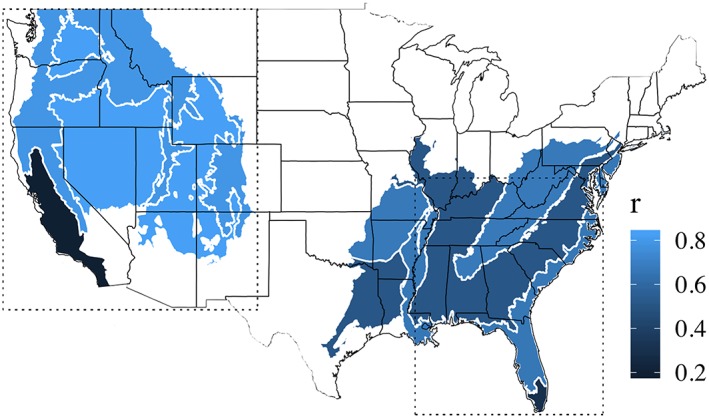
Figure 7.

Spearman correlation coefficient (r, mapped as color) for the interannual burn area by ignition type (human and lightning) in each ecoregion between 1992 and 2015. The west and southeast regions are shown with the dashed‐line boxes, only wildfires that occurred within the plotted ecoregions and boxes were used for the correlation calculations.
