Fig. 2.
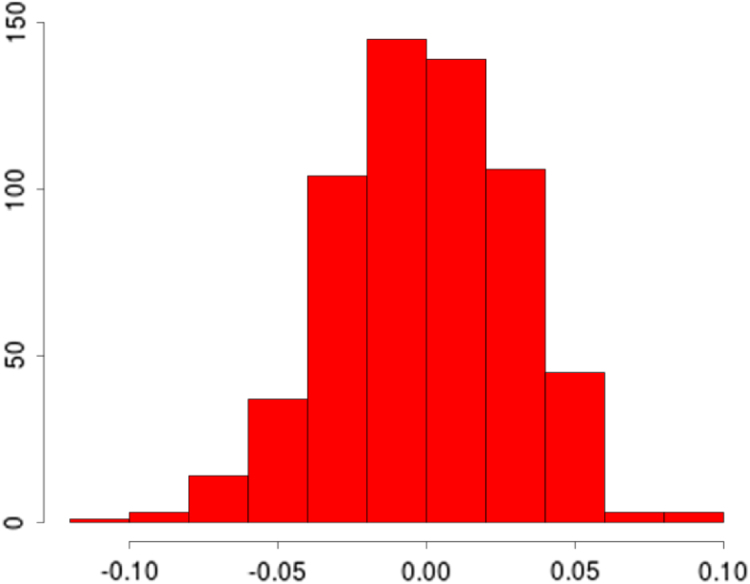
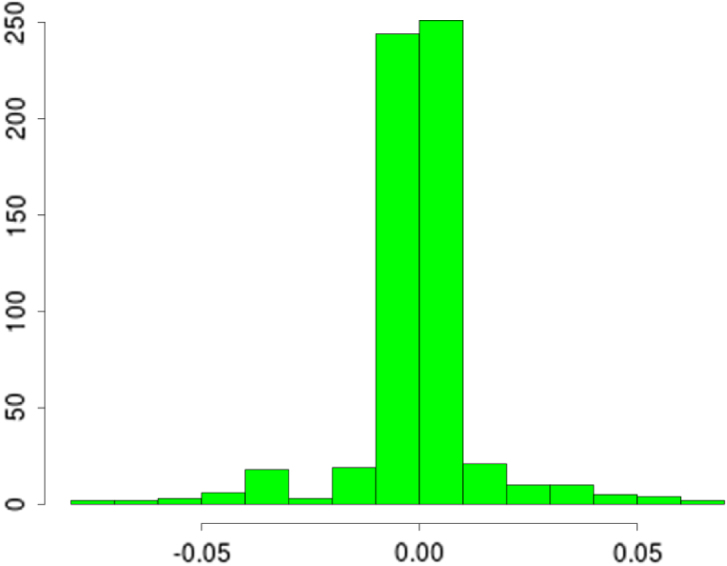
(top left) Log marginal likelihood (-axis), optimisation gradient update count (-axis), vanilla random features (blue), proposed approach (red); (top right) Histogram of learnt for our nonstationary approach; (bottom left) Histogram of learnt for our nonstationary approach; (bottom right) Histogram of for vanilla random Fourier features. (For interpretation of the references to colour in this figure legend, the reader is referred to the web version of this article.)
Fig. 2(a).

(a)
Fig. 2(b).

(b)
Fig. 2(c).

(c)
Fig. 2(d).

(d)
