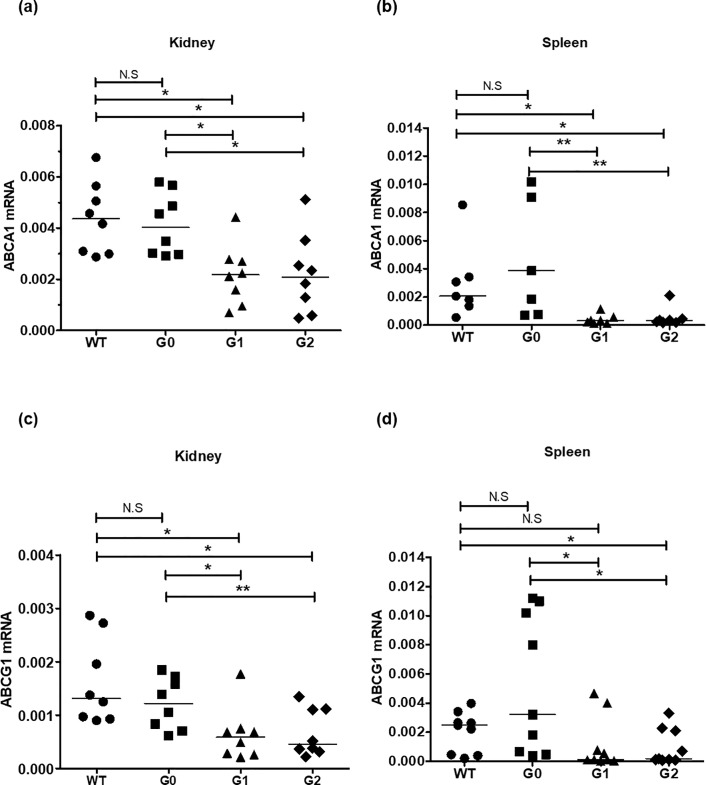
Fig 3. Expression of cholesterol transporters in BAC/APOL1 mouse kidney and spleen.
Total RNA was isolated from kidney and spleen, and relative ABCA1 and ABCG1 mRNA levels were evaluated by quantitative RT-PCR. ABCA1 mRNA levels were lower in APOL1-G1 and APOL1-G2 risk variant (A) kidney and (B) spleen compared to APOL-G0 mice. ABCG1 mRNA levels were also lower in the APOL1-G1 and APOL1-G2 groups of (C) kidney and (D) spleen compared to APOL1-G0 mice. WT; wild type. Median is shown by a horizontal bar. Mann-Whitney U-test; * P < 0.05, ** P < 0.01.

