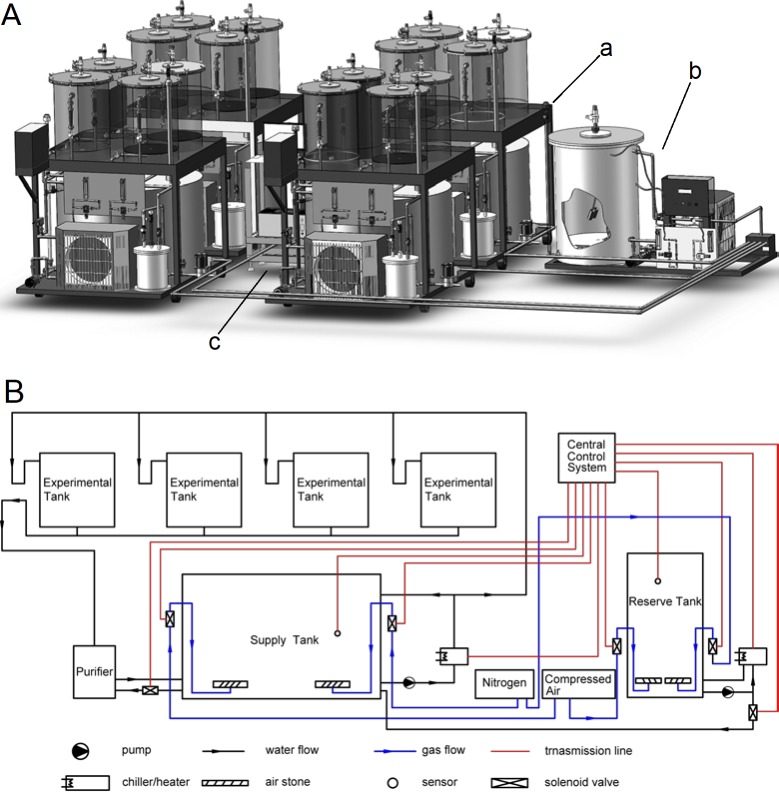
Fig 1. Design of the automated hypoxia simulation device.
(A) The sketch showed the main structure of the device. The structure labeled with ‘a’ was the environmental simulation system; the structure labeled with ‘b’ was the water-exchange system; the structure labeled with ‘c’ was the central control system. (B) A logic diagram indicated how the device was running, including the water flow and gas flow.

