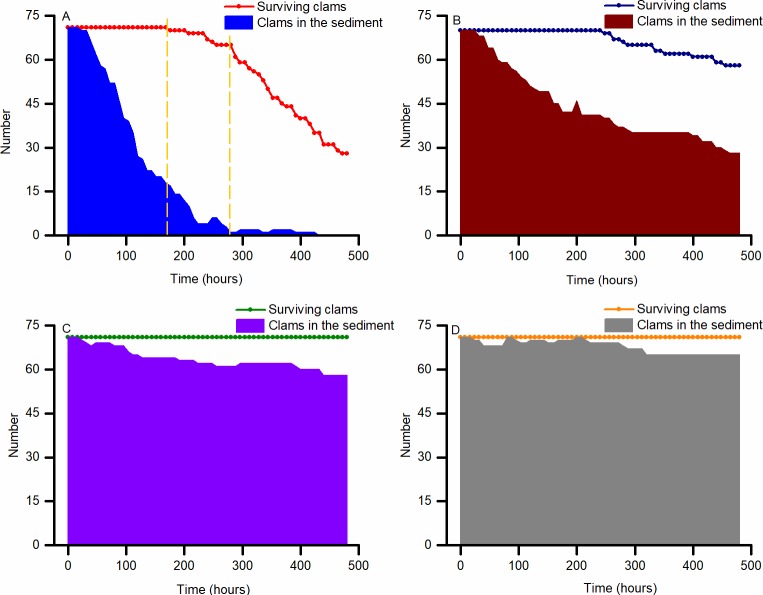
Fig 3. Changes in the number of surviving and buried Ruditapes philippinarum in Experiment 1.
(A) Treatment group exposed to 0.5 mg L-1 DO. The dashed lines denote the estimated critical-time thresholds dividing the curve into different phases; the first dashed line marks the beginning of the mortalities, and the second cuts the rest of the curve into two parts that could each be linearly fitted with best fitness (the largest sum of R values in Excel). (B) Treatment group exposed to 1.0 mg L-1 DO. (C) Treatment group exposed to 2.0 mg L-1 DO. (D) Control group maintained at 6.0 mg L-1 DO. N = 72 per treatment.

