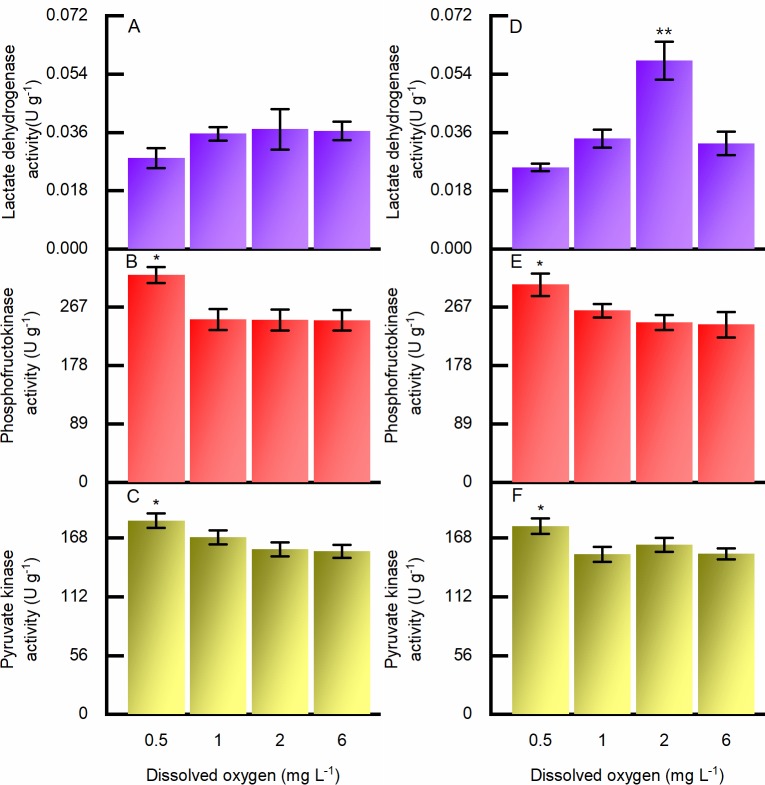
Fig 6. Biochemical responses to hypoxia measured in adductor muscle of Ruditapes philippinarum on the 10th day and at the end of the experiment, under different DO concentrations.
(A) Lactate dehydrogenase activity on the tenth day; (B) phosphofructokinase activity on the tenth day; (C) pyruvate kinase activity on the tenth day. (D) lactate dehydrogenase activity at the end of experiment; (E) phosphofructokinase activity at the end of experiment; (F) pyruvate kinase activity at the end of experiment. Error bars indicate mean ± SE (** indicates p < 0.01, * indicates p < 0.05).

