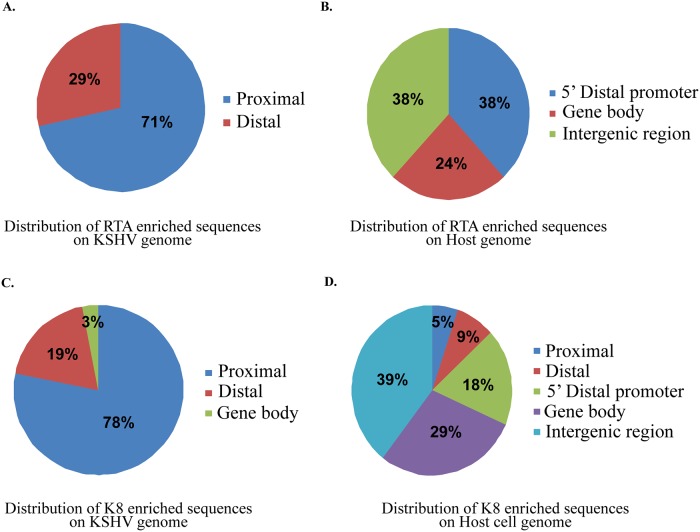
Fig 2. Relative distribution of K-RTA and K8 enriched sequences on KSHV as well as cellular genome identified through ChIP-seq.
(A) Analysis of the K-RTA binding sites on the KSHV genome identified 71% of K-RTA binding sites in the proximal promoter region, whereas remaining 29% in the distal promoter region. (B) Mapping of the K-RTA binding site on the cellular genome identified majority of the enriched sequence in the intergene region (38%) or within the gene body (24%), while remaining 38% in the distal promoter region. (C) Relative distribution of K8 enriched sequence on the KSHV genome identified 78% of K8-enriched sequence in the proximal promoter region with 19% being in the distal promoter region and 3% in the gene body. (D) Analysis of the distribution of K8 enriched sequences on the host genome showed that most of the enriched sequences were in intergene region (39%) or within the gene body (29%), with the remaining 32% in the 5’ distal promoter region, comprising of both proximal (9%) and distal (5%) promoters.

