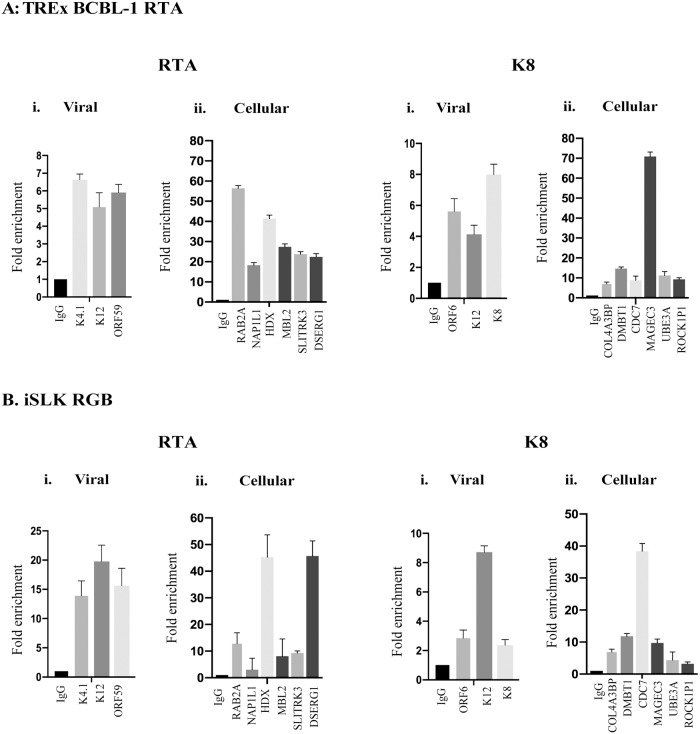
Fig 6. ChIP and quantitative PCR analyses of K-RTA and K8 binding sites identified using ChIP-Seq.
The fold enrichment of K-RTA and K8 enriched viral and cellular genes were calculated relative to that of anti-IgG, serving as a negative control using: (A) TRExBCBL-1 RTA, and (B) iSLK RGB cells. Quantitative real time-PCR was performed to analyze the levels of K-RTA enriched viral (K4.1, K12, ORF59), cellular (RAB2A, NAP1L1, HDX, MBL2, SLITRK3, DSERG1), and K8 enriched viral (ORF6, ORF12, K8) as well as cellular (COL4A3BP, DMBT1, CDC7, MAGEC3, UBE3A, ROCK1P1) genes. The error bars represent standard deviations from the mean of at least three experimental replicates.

