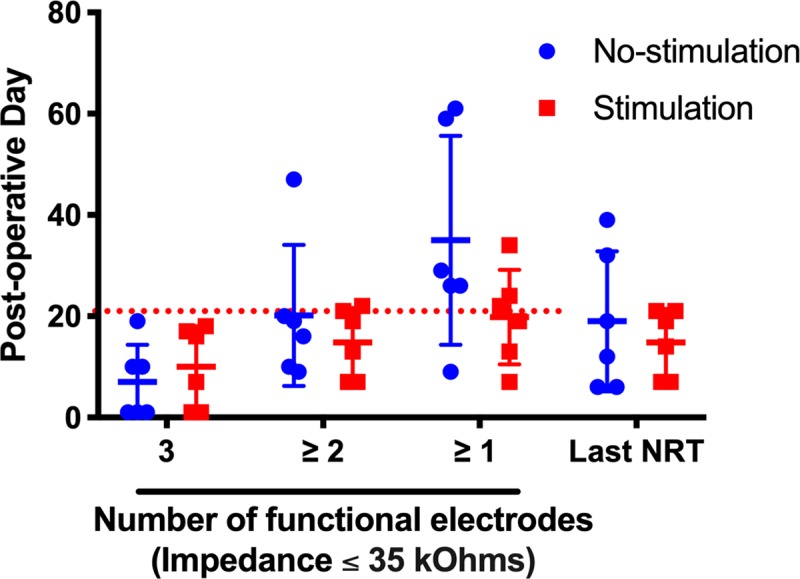
Fig 5. Impedance and NRT over time.

Mean and individual duration of electrode functionality (impedance ≤ 35 kOhms) and time of last obtainable NRT recording. The left side of the figure portrays the duration that each implant maintained the respective number of functioning electrodes. The right side of the figure portrays the last timepoint at which an NRT response could be obtained for each implant. Non-stimulated subjects are represented by blue circles and stimulated subjects by red squares. Horizontal bars represent mean group values. The red, dotted line marks the 21 day experimental endpoint threshold. 5/6 and 3/6 subjects in the no-stimulation and stimulation groups met or surpassed the 21 day threshold of maintaining at least one functional electrode, respectively. NRT responses were generally obtainable while at least 2 electrodes maintained impedance levels ≤ 35 kOhms. Error bars represent Standard Deviation.
