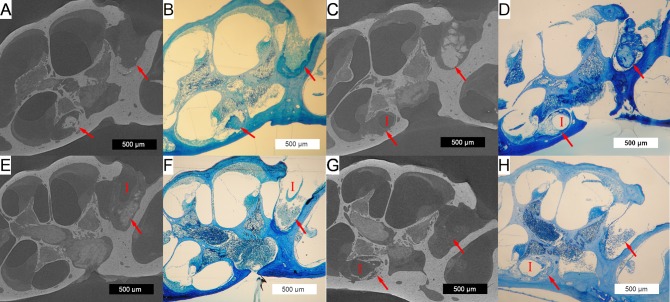
Fig 9. 3D x-ray microscopy and histologic co-localization.
3D x-ray microscopic images (A,C,E&G) are co-localized next to corresponding histologic sections (B,D,F and H) for non-stimulated (A-D) and stimulated (E-H) subjects. The implant tract (marked by a red “I”, where visible) with adjacent soft tissue and neo-osteogenesis is seen in the round window and basal turn of the scala tympani. Representative 500μm scale bars are provided for each image. Red arrows mark the tissue response within the scala tympani and round window area.

