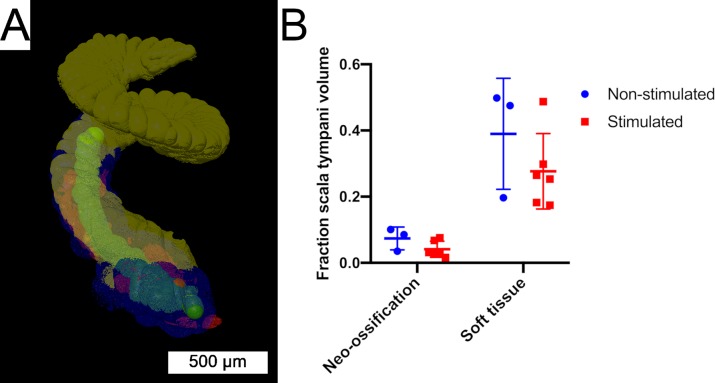
Fig 10. Volumetric cochlea segmentation.
(A) 3D rendering of a volume segmented 3D x-ray microscopy cochlea image stack. Regions of interest include the implant tract (green), soft tissue response (blue), neo-ossification (red) and unoccupied scala tympani (yellow). (B) The fractional volume of the scala tympani occupied by neo-ossification or soft tissue response was quantified. Individual data for non-stimulated (blue dots) and stimulated (red squares) subjects are include with horizontal bars showing group mean values. There were no significant differences between groups (p>0.5). Error bars provide SD.

