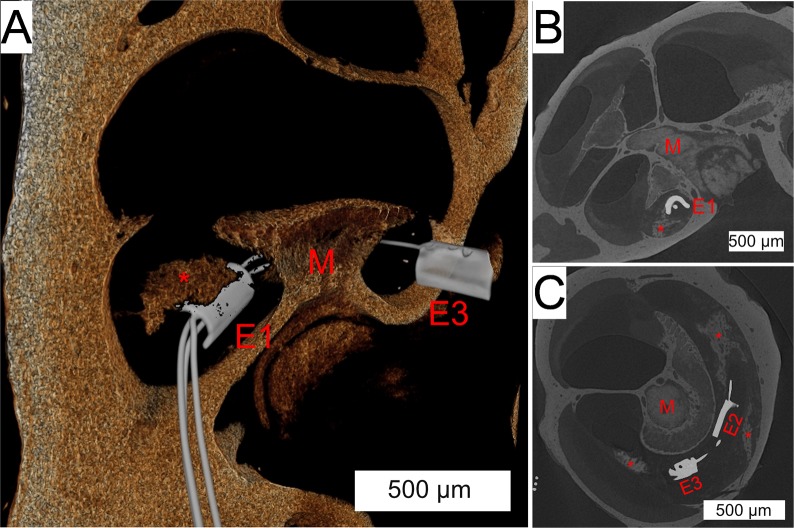
Fig 11. Co-registration of electrode array within 3D x-ray microscopic images.
(A) 3D reconstruction of a 3D x-ray microscopic image shows the array trajectory through the scala tympani, around the modiolus (red “M”). The most apical electrode (red “E3”) and most basal electrode (red “E1”) are seen with a peri-modiolar orientation, with the middle electrode obscured by the modiolus. The red “*” denotes a foci of peri-implant neo-osteogenesis. Coronal (B) and axial (C) sections show the intrascalar orientation and trajectory of the implant with multiple areas of neo-osteogenesis (red “*”). The most basal (red “E1”), middle (red “E2”) and apical (red “E3”) are seen.

