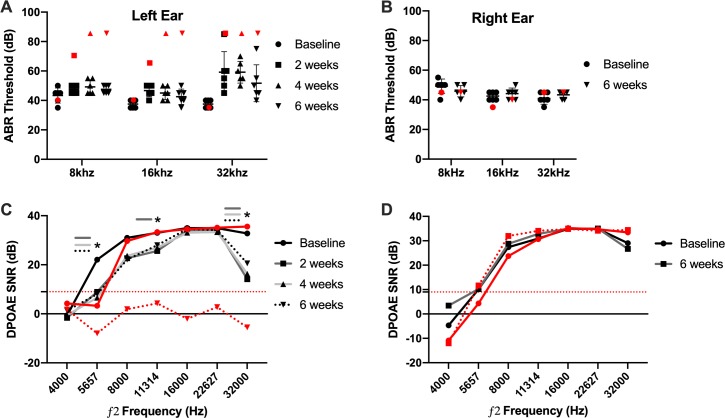
Fig 12. ABR and DPOAE measures of hearing preservation.
Left, implanted (A) and right, non-implanted (B) ear ABR thresholds are plotted by individual subject with representative black symbols according to testing day. The black horizontal bars represent mean values. Red symbols indicate the 1 subject excluded secondary to significant hearing loss post-implantation. ABR thresholds maintained within 15 dB SPL of baseline values for all experimental subjects (black symbols) at the 8 and 16 kHz frequencies. There were no significant differences between timepoints at any frequency (p>0.05). Error bars represent SD for the 6 subjects meeting hearing preservation criteria. (C) and (D) show mean DPOAE signal to noise ratio (SNR) for the left (implanted) and right (non-implanted) ears, respectively. ‘*’ denotes statistically significant (p>0.05) difference from baseline SNR values at respective timepoints. Within our system, a SNR ≥ 9 is considered an intact DPOAE; this threshold is denoted by the red, dotted horizontal line. The solid red line represents baseline values for the 1 excluded subject and the dotted red line represents final 6-week DPOAE SNR values.

