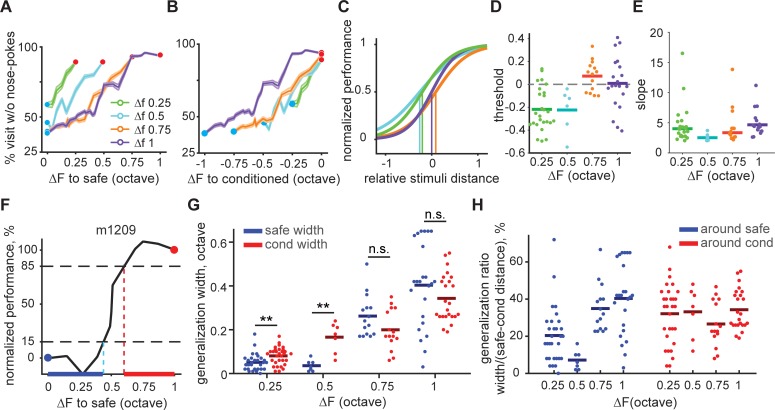
Fig 3. Asymmetrical generalization gradients in mice trained with small ΔFs.
(A) Average performance as a function of frequency distance to the safe tone across groups trained with different ΔFs. (B) Average performance as a function of frequency distance to the conditioned tone across groups trained with different ΔFs. (C) Fitted psychometric curves and thresholds (vertical line). (D-E) Individual mouse threshold and slope of the psychometric curves in (C). (A-E) Color coding is based on the ΔF. (F) Example generalization width around the safe (blue line) and conditioned (red line) tone estimated for one mouse. (G) Generalization width for all mice. Here and in subsequent figures, *p < 0.05, **p < 0.01, ***p < 0.001, ****p < 0.0001; n.s., not significant (p > 0.05). (H) Relative generalization width as percentage of the safe-to-conditioned distance for all mice.

