
Fig 6. Result of RMSF of three inhibitor-protein complex systems during 400 ns MD simulation.
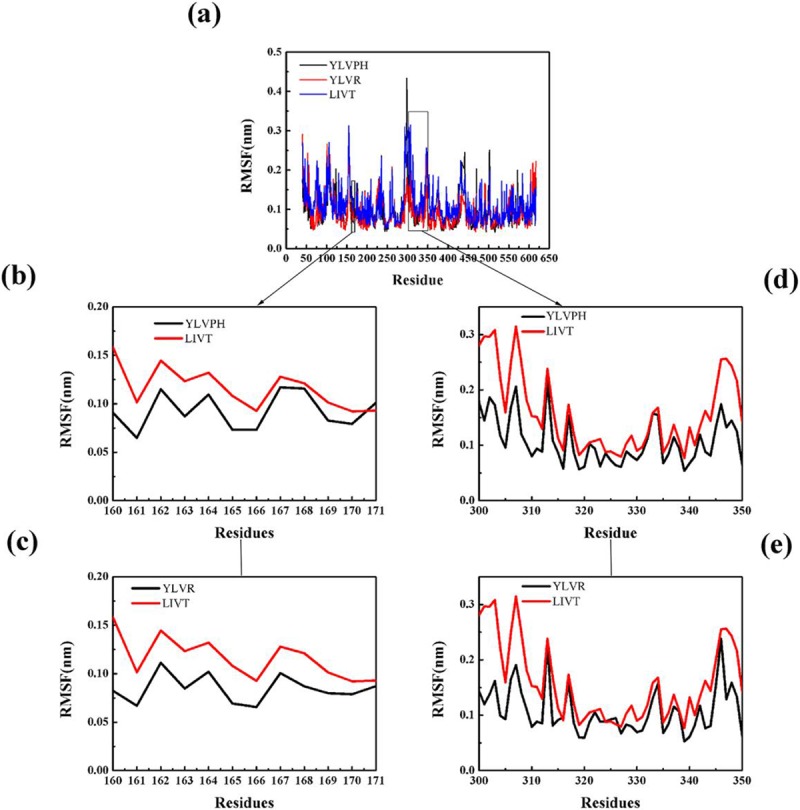
(a) Total RMSF of three inhibitor-protein complex systems (YLVPH is shown in black, YLVR is shown in red, LIVT is shown in blue). (b-c) Comparison of the effects of different inhibitors on RMSF for α5. (d-e) Comparison of the effects of different inhibitors on RMSF for α10–12.