
Fig 7. Results of covariance of three inhibitor-protein complex systems.
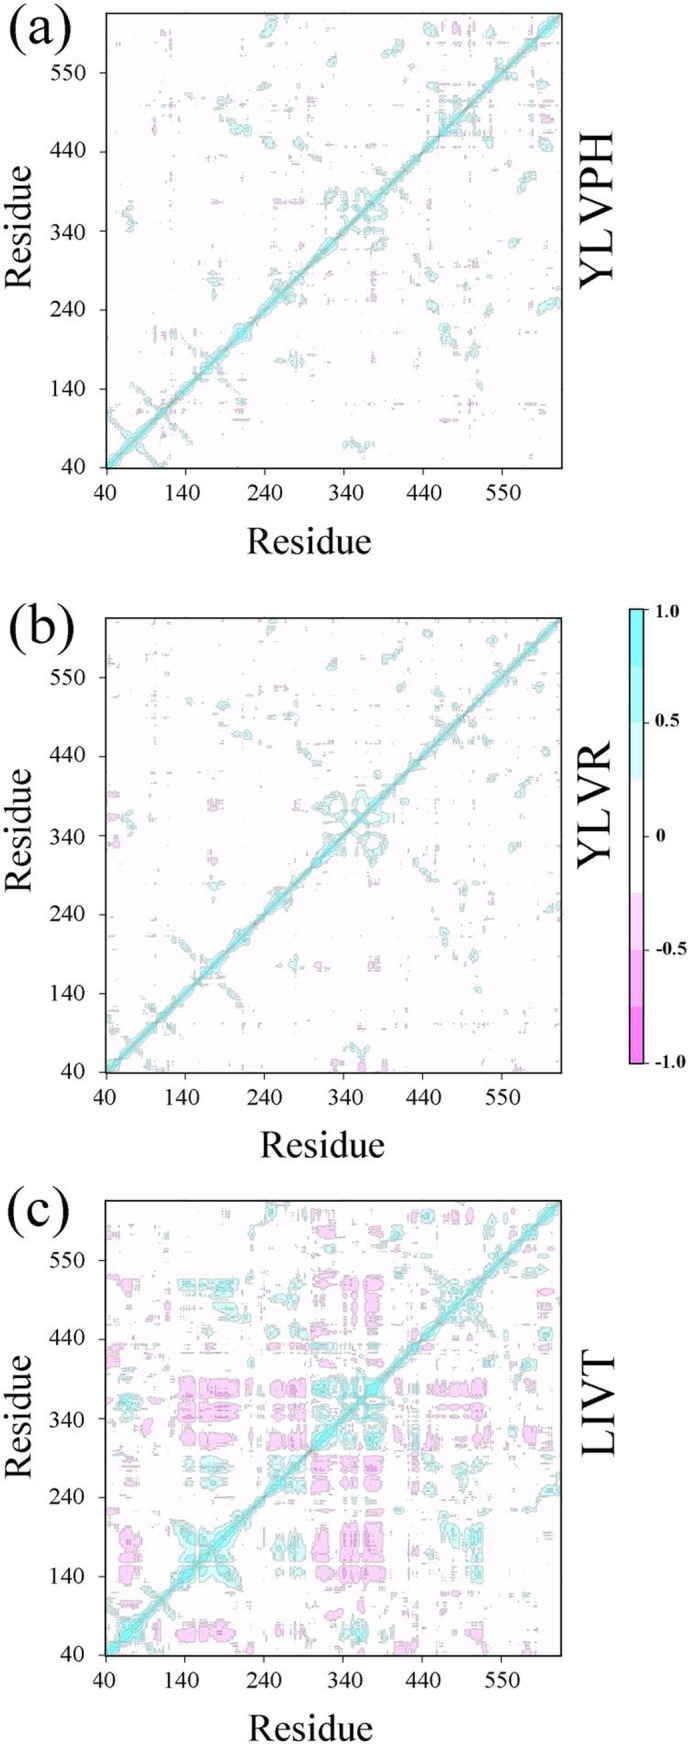
The cross-correlation matrix maps for (a) ACE-YLVPH, (b) ACE-YLVR, and (c) ACE-LIVT systems. The positive regions, marked in cyan, indicate the strongly correlated motions of residues, whereas the negative regions, colored by pink, are associated with the anti-correlated movements.