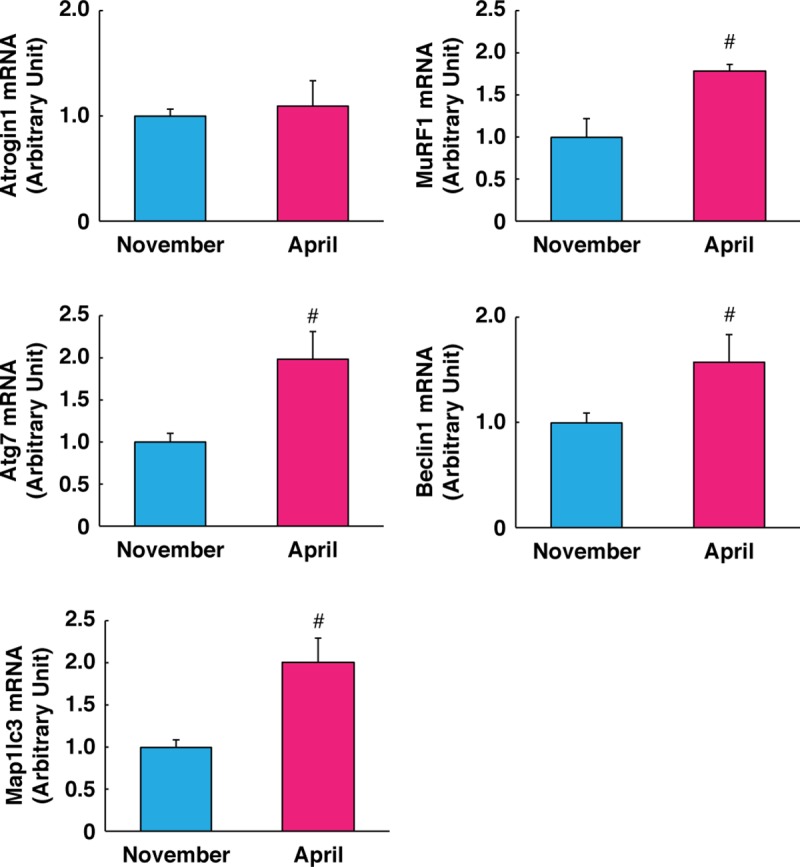
Fig 2. Gene expression of protein breakdown pathways.

Gene expression levels of the ubiquitin-proteasome system (atrogin1 and murf1) and autophagy-lysosome system (atg7, beclin1, and map1lc3) were quantified by real-time PCR. RPL26 was used as an internal control for the 2–ΔΔCT method. N = 3 in each group. Data are expressed as mean ± standard error. Significant differences: #, p < 0.05.
