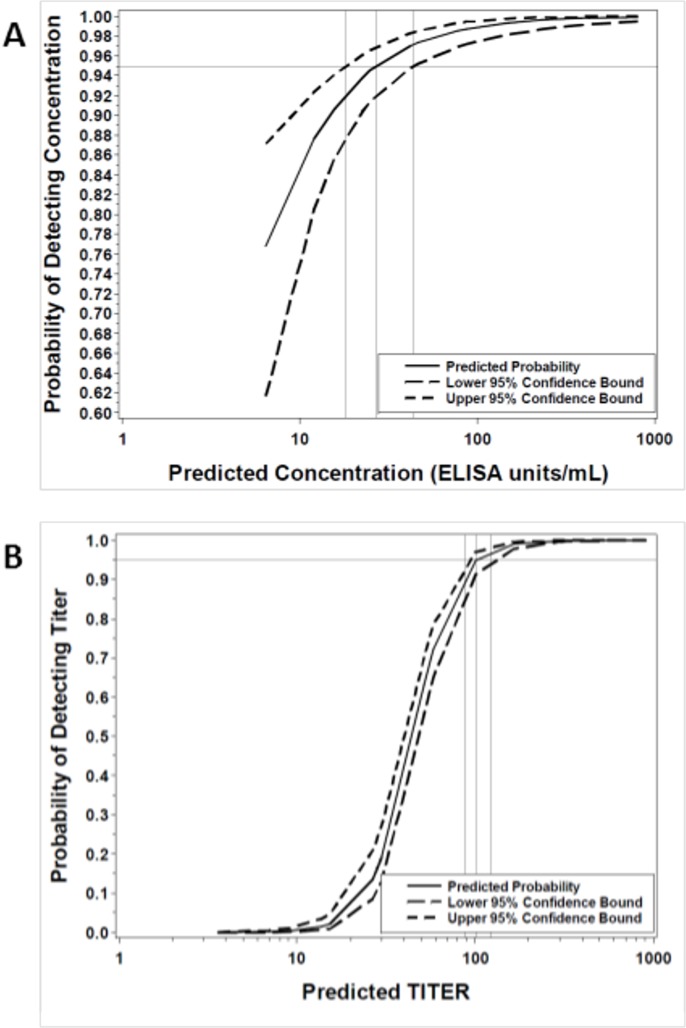
Fig 1. Estimated limits of detection.
The logistic curves for the relationship between the probability of detecting the anti-EBOV GP IgG concentration (A) or endpoint titer (B) of a given sample and the predicted log-transformed value are represented by the solid lines, while dotted lines represent the upper and lower 95% confidence bounds for the estimate.

