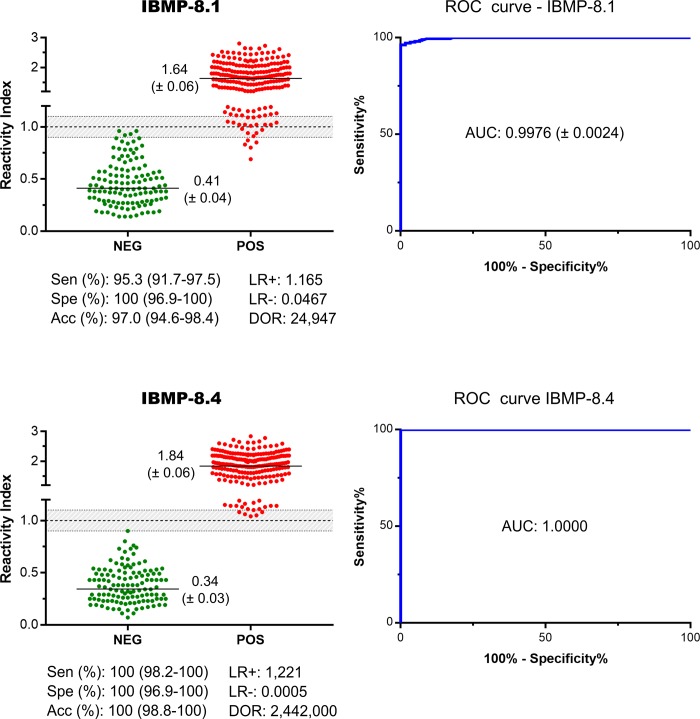
Fig 3. Reactivity index and performance parameters obtained with serum samples from T. cruzi-infected (POS) and non-infected (NEG) individuals.
The cut-off value is reactivity index = 1.0 and the shadowed area represents the grey zone (RI = 1.0 ± 0.10). Horizontal lines and numbers for each group of results represent the geometric means (± 95% CI). AUC (Area Under Curve); Sen (Sensitivity); Spe (Specificity); Acc (Accuracy); LR (Likelihood Ratio); DOR (Diagnostic Odds Ratio).

