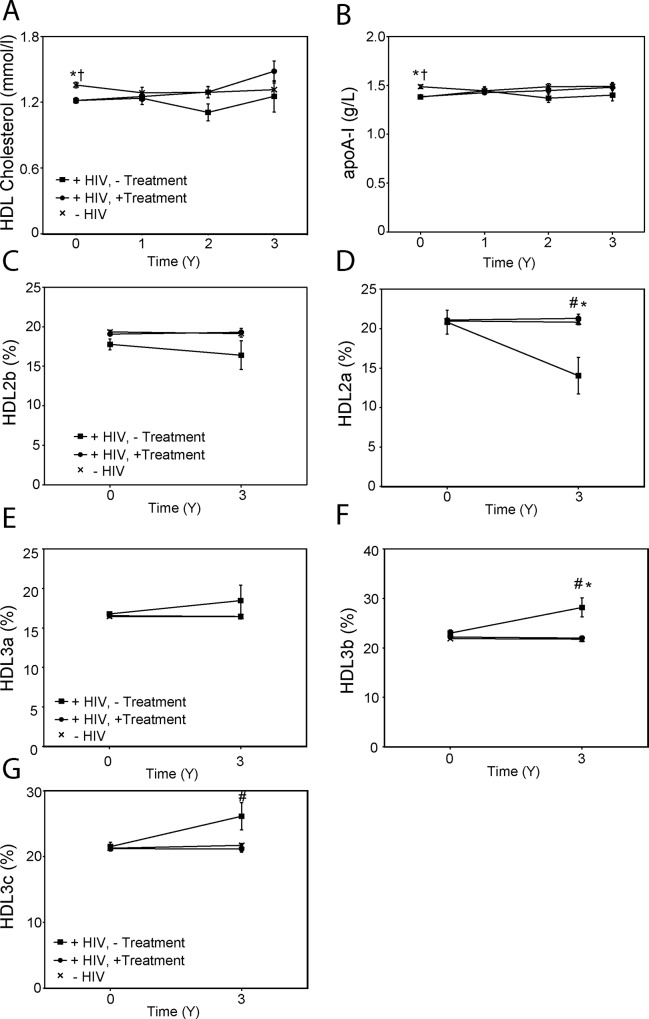
Fig 5. High density lipoproteins.
A–Plasma HDL cholesterol levels; B–Plasma apoA-I levels; C—Proportion of HDL2b particles in total HDL; D—Proportion of HDL2a particles in total HDL; E—Proportion of HDL3a particles in total HDL; F—Proportion of HDL3b particles in total HDL; G—Proportion of HDL3c particles in total HDL. “+HIV,—Treatment”–HIV-positive untreated group; “+HIV, + Treatment”–HIV-positive treated group; “-HIV”–HIV-negative group. #p< 0.05 HIV-positive treated versus HIV-positive untreated group; *p<0.05 HIV-negative versus HIV-positive untreated group; †p<0.05 HIV-negative versus HIV positive treated group.

