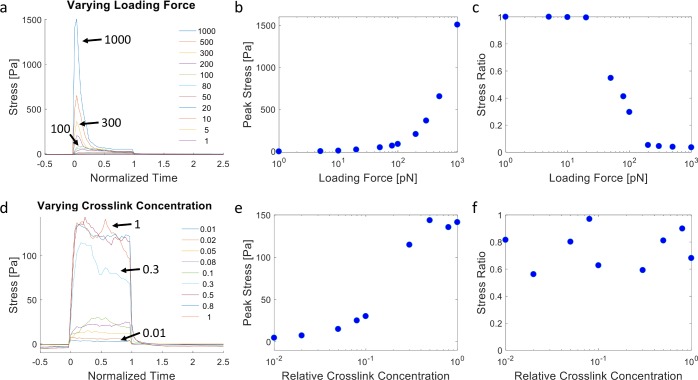
Fig 5. Stress generation in the dynamic ECM from discrete network simulations.
(a) Overall stress vs. time in the ECM network during dynamic force loading for different loading force magnitudes as indicated by the arrows and color legend (in pN). (b) Peak stress in the network as a function of the loading force. (c) Ratio between the stress immediately before stopping loading forces (t = 1) and peak stress as a function of the loading force magnitude. (a,b,c) correspond to the same simulations as Fig 4A and 4B. (d) Overall stress vs. time in the ECM network during dynamic force loading for different relative crosslink concentrations as indicated by the arrows and color legend. (e) Peak stress in the network as a function of the relative crosslink concentration. (f) Ratio between the stress immediately before stopping loading forces (t = 1) and peak stress as a function of the relative crosslink concentration. (d,e,f) correspond to the same simulations as Fig 4C and 4D. Statistical assessment from triplicate simulations are shown in S6 Fig.

