
Fig 6. Comparison of simulations and experiments.
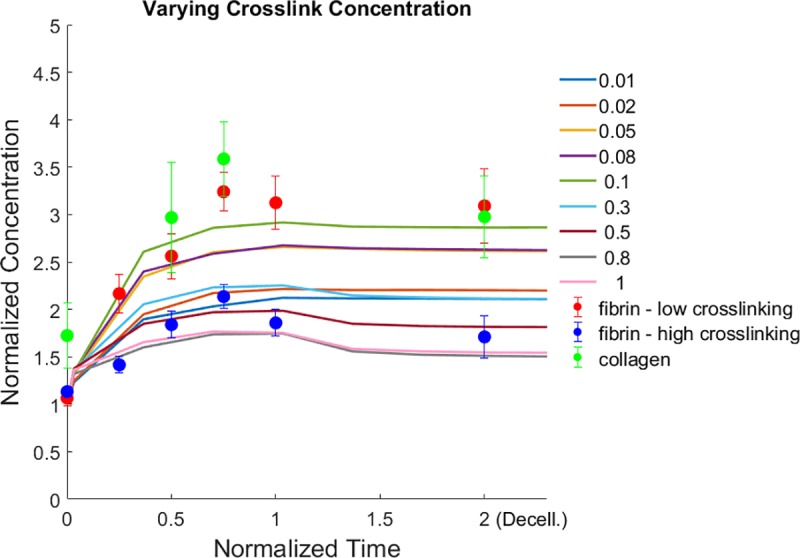
Experimental profiles for fibrin and collagen intensities over time are compared with simulations for varying crosslink concentration. For consistency, the accumulation zone for measuring ECM density is here set to 5μm from the cell/loading surface for both experiments and simulations. For simulations, loading forces are stopped at the normalized time of 1. For experiments, time is normalized to 4 hrs, when the intensity levels appear to plateau, and experimental data points after the normalized time of 1 indicate post-decellularization as in Fig 1. Different colored curves represent simulation results with different crosslinker concentrations, as indicated in the legend. Simulation results are from the same conditions and data as in Fig 4C. Circles are experimental data, and error bars are SEM, with N = 5 cells per experimental condition.